Climate Daily Signal: Creator & Fan Guide — Aug 1, 2026
A creator-first field guide to reading climate signals, separating weather from trend, turning data into compelling stories, and keeping fan communities informed without feeding doom, hype, or misinformation.
 Aiyana GreyhorseFeatures writer
First published 8/1/2026 · last revised 8/5/2026 with fresh sources, corrections, and new context. Reader corrections are reviewed and folded into future versions.
Summary
Climate news arrives like a disaster-movie trailer: flashing radar, orange skies, broken records, dramatic music. A climate daily signal is the meaningful pattern beneath that spectacle—the combination of measurements, trends, attribution research, and local context that shows how a warming planet is changing everyday conditions. For creators and fandom communities, the challenge is not merely finding a dramatic event. It is explaining what scientists know, what remains uncertain, and why viewers should care without turning evidence into clickbait. This CineMind guide provides a practical system for decoding heat, storms, wildfire, oceans, and emissions; checking sources; designing visuals; moderating discussion; and transforming passive anxiety into informed participation.
Key takeaways
- Weather is the scene; climate is the franchise arc. One hot day proves little, while long-term records reveal changing probabilities and extremes.
- Earth has warmed by roughly 1.2°C above the 1850–1900 average in recent years, increasing the baseline from which heat waves and other hazards develop.
- Use primary sources such as NASA, NOAA, the IPCC, Copernicus, and peer-reviewed attribution studies before repeating viral claims.
- Never say climate change caused a specific event unless robust attribution evidence supports that wording; explain how warming changed its likelihood or intensity instead.
- A useful creator package combines one verified number, one clear visual, one human consequence, one uncertainty statement, and one constructive action.
- Local context beats generic apocalypse. Tell audiences what a signal means for their city, favorite convention, film production, esports event, or outdoor community.
- Moderation is part of climate communication: publish source links, prohibit harassment, correct errors visibly, and distinguish honest questions from coordinated misinformation.
- Avoid doom loops. Audiences engage longer when stories include agency, adaptation, innovation, accountability, or measurable progress alongside danger.
Explain like I'm 5
Imagine Earth is a giant livestream with a very long VOD archive. Weather is what happens during one minute of the stream: rain, sunshine, a brutal heat spike. Climate is what analysts discover after reviewing decades of footage. Greenhouse gases act like an extra blanket, trapping more heat in the system. That does not script every storm beat-by-beat, but it changes the stage on which weather performs. A climate daily signal is a clue visible now—a temperature record, unusually warm ocean, shrinking ice, rising sea level, or altered fire conditions—that makes sense only when compared with historical data. Your creator job is to freeze the frame, show the archive, explain the physics, and avoid pretending one spectacular clip tells the entire story.
Deep dive
What the climate daily signal actually is
The signal is not a single dashboard number or alarming thumbnail. It is the evidence that emerges when observations are compared across time and connected to physical mechanisms. NASA and NOAA track global temperature; Copernicus monitors atmosphere, ocean, and land; the World Meteorological Organization synthesizes records; the IPCC assesses thousands of studies. Together they show a planet roughly 1.2°C warmer than the 1850–1900 baseline in recent years. That shift sounds small only if Earth is mistaken for a thermostat. Globally averaged warming redistributes energy through oceans, ice, soil, and air. Think less ‘one-degree sequel’ and more ‘the game engine has been patched.’ The rules governing heat extremes, rainfall, evaporation, and coastal flooding now operate from a different starting state.
Weather is the episode; climate is the season arc
A cold snap does not disprove global warming, just as one blockbuster flop does not end cinema. Climate describes statistical patterns measured over decades; weather describes short-term conditions. Creators should therefore compare like with like: daily temperature against the same location and season, ocean heat against a long baseline, or wildfire danger against historical fuel and moisture conditions. Records matter, but context matters more. Ask whether a record is local, national, or global; daily, monthly, or annual; measured by thermometer, satellite, or model; and whether the dataset has been finalized. El Niño and La Niña can temporarily raise or lower global temperatures, while volcanic eruptions, aerosols, and regional circulation add variation. Human-driven warming supplies the rising background trend beneath that natural noise.
Attribution: the detective scene, not a magic wand
When an extreme event trends, the safest instant sentence is: climate change can influence the odds or severity of this type of event, but this specific case requires analysis. Event-attribution scientists compare the observed world with modeled counterfactual worlds lacking much human-caused warming. They may estimate that an event became several times more likely or a measurable amount hotter. Confidence differs by hazard. Heat has a particularly direct relationship to global warming; heavy precipitation also has strong physical support because warmer air can hold about 7% more water vapor per degree Celsius. Tropical cyclones, tornadoes, floods, droughts, and wildfires involve additional variables such as wind shear, land use, ignition, drainage, vegetation, and water management. Report the study’s exact geography, dates, metric, confidence, and limitations. Do not upgrade ‘more likely’ into ‘caused.’
Build a climate story fans will actually watch
Open with a recognizable frame: a heat-delayed concert, smoke over a game studio’s city, an anime convention adapting its queue plan, or virtual-production crews managing hotter stages. Then deploy the CineMind signal stack. First, show one verified metric. Second, anchor it to a baseline. Third, explain the mechanism with a visual metaphor that does not distort the science. Fourth, identify who experiences the consequence. Fifth, state uncertainty plainly. Sixth, offer a meaningful next move. Use maps with legends, charts with labeled axes, and on-screen citations. For Shorts or TikTok, place the source in the video and caption because descriptions are often ignored. For livestreams, prepare a source scene containing links and timestamps. For YouTube essays, separate observation, interpretation, and opinion through chapter cards or visual styling.
Protect the community from hype and despair
Climate content attracts three engagement traps: catastrophe thumbnails that outrun evidence, false-balance debates that place established physics against unsupported denial, and doom narratives that erase agency. Replace them with calibrated urgency. Say what is happening, how confidently scientists know it, who is exposed, and what choices alter outcomes. Avoid using disaster footage from another year or country as generic B-roll; reverse-search clips and label archival material. Never expose private victims or encourage fans to enter hazardous areas for content. Moderate around claims rather than identities: request sources, remove harassment, pin corrections, and preserve a visible update log. Eco-anxiety is real, especially among younger viewers. Pair difficult findings with credible responses—heat plans, clean-energy deployment, resilient production practices, public transit, restoration, policy scrutiny, and mutual aid—without pretending individual lifestyle changes can substitute for institutional action.
A repeatable creator workflow
Before publishing, run SIGNAL: Source, Interval, Geography, Nuance, Attribution, and Landing. Source means locating the primary dataset or paper. Interval means checking the baseline and time span. Geography prevents a regional anomaly from becoming a global claim. Nuance identifies uncertainty and competing influences. Attribution verifies whether researchers connected the event to human-caused warming. Landing gives the audience a constructive destination: a preparedness page, full report, local resource, or participation prompt. Save screenshots and archived links, record dataset update times, and ask an independent expert to review high-stakes scripts. If a number changes, correct the title, caption, pinned comment, and downloadable graphics—not merely a quiet line in the description. Trust is the creator’s most valuable renewable resource.
- 1850–1900Scientists commonly use this period as the pre-industrial reference baseline for calculating modern global warming.
- 1958Charles David Keeling begins continuous atmospheric carbon dioxide measurements at Mauna Loa, producing the iconic Keeling Curve.
- 1988The Intergovernmental Panel on Climate Change is established by the WMO and United Nations Environment Programme.
- 2015The Paris Agreement sets a goal of holding warming well below 2°C and pursuing efforts to limit it to 1.5°C above pre-industrial levels.
- 2021The IPCC Sixth Assessment Report states that human influence has unequivocally warmed the atmosphere, ocean, and land.
- 2023The WMO confirms 2023 as the warmest year in the observational record at that time, around 1.45°C above the 1850–1900 average.
- 2024Copernicus reports 2024 as the first calendar year averaging more than 1.5°C above the pre-industrial level, while noting that the Paris threshold concerns long-term warming, not one year.
- 2030sCreator coverage will increasingly merge live hazard data, provenance labels, local adaptation tools, and AI-assisted translation—making verification skills more important, not less.
Glossary
- Attribution science
- Research estimating how human-caused climate change altered the likelihood or intensity of a specific extreme event.
- Baseline
- A defined reference period against which temperature, rainfall, ice, or another climate variable is compared.
- Carbon dioxide equivalent
- A common unit expressing the warming impact of different greenhouse gases relative to carbon dioxide over a selected time horizon.
- Climate anomaly
- The difference between an observed value and the average value for a chosen baseline period.
- El Niño
- The warm phase of a recurring Pacific Ocean pattern that shifts weather globally and can temporarily boost global average temperature.
- Mitigation
- Actions that reduce greenhouse-gas emissions or increase their removal from the atmosphere.
- Adaptation
- Changes that reduce harm from current or expected climate impacts, such as cooling centers or flood-resilient infrastructure.
- Net zero
- A state in which remaining human-caused greenhouse-gas emissions are balanced by durable removals; scope and accounting rules matter.
- Tipping point
- A critical threshold beyond which part of the Earth system may shift substantially, potentially becoming difficult to reverse.
FAQs
Does one record-hot day prove climate change?+
No. A single day is weather. Its significance comes from long-term trends, record frequency, spatial extent, and attribution evidence. Human-caused warming raises the baseline and can make extreme heat more likely and intense.
Does one cold day disprove global warming?+
No. Regional cold still occurs on a warming planet. Global climate is evaluated using long-term averages across the whole Earth, not one location or week.
Can I say climate change caused a hurricane or wildfire?+
Usually not in that absolute form. Say how warming affected relevant conditions—such as ocean heat, rainfall intensity, fuel dryness, or fire weather—and cite event-specific attribution when available.
Why do some sources use different warming numbers?+
They may use different baselines, datasets, geographic coverage, methods, or time windows. State the source and comparison period rather than presenting a number without context.
Did passing 1.5°C in a single year mean the Paris goal permanently failed?+
No. The Paris temperature goal concerns long-term global warming, typically assessed over decades. A single year above 1.5°C is a serious warning signal, not the same as formally crossing the long-term threshold.
What is the best chart format for social video?+
Use a simple time series with a labeled baseline, source, units, and restrained color scale. Animate only when motion clarifies change; never let visual drama exaggerate the data.
How should livestreamers handle climate misinformation in chat?+
Publish chat rules, keep primary links ready, ask for evidence, correct claims without amplifying every troll, time out repeat offenders, and pin a concise source-backed explanation.
Can creators use AI to summarize climate reports?+
Yes, as an assistant—not an authority. Verify every number, quotation, date, and conclusion against the original report because models can invent citations or flatten scientific uncertainty.
Predictions
- Real-time attribution will move closer to the news cycle, giving creators faster estimates while increasing the need to label preliminary findings.
- Climate overlays will become standard in sports, festival, travel, production, and gaming-event coverage as heat and air quality affect schedules and safety.
- Platforms will add stronger provenance tools for disaster footage, including capture metadata, location verification, and synthetic-media labels.
- Fan communities will organize more participatory projects: heat-resource maps, translation squads, charity streams, citizen-science observations, and accountability trackers.
- Virtual production and game studios will market energy, travel, and hardware efficiency, prompting audiences to demand comparable accounting rather than vague green branding.
- Climate fiction will shift from distant apocalypse toward adaptation thrillers, workplace dramas, solarpunk worlds, and stories about unevenly distributed risk.
Risks
- False certainty: declaring that one event was ‘caused by climate change’ can misrepresent attribution research and damage credibility.
- Context collapse: cropping axes, omitting baselines, or confusing local records with global ones can make true data misleading.
- Synthetic disaster media: AI-generated fires, floods, and storm images can spread faster than corrections, especially during breaking news.
- Trauma exploitation: graphic footage and disaster reaction content can dehumanize affected communities or expose private information.
- Doom fatigue: nonstop catastrophe framing may drive avoidance, helplessness, or hostile polarization instead of durable engagement.
- Greenwashing: sponsorships built on unverified offsets or vague ‘carbon neutral’ language can compromise creator independence.
- Safety failures: encouraging storm chasing, smoke exposure, or travel into evacuation zones can put creators, fans, and responders at risk.
Opportunities
- Create a recurring 60-second ‘signal check’ that explains one chart, one caveat, and one practical consequence.
- Build fandom-specific explainers, such as how heat affects cosplay materials, outdoor queues, location shoots, PC cooling, or esports venues.
- Partner with climate scientists, emergency managers, health experts, animators, and data journalists for verified crossover streams.
- Turn passive viewers into contributors through local observation logs, open-source map annotation, subtitle translation, and mutual-aid fundraising.
- Develop reusable source cards, correction templates, chart presets, and moderation macros as part of a creator verification toolkit.
- Audit production choices—travel, generators, sets, merchandise, cloud workloads—and publish measurable improvements without claiming perfection.
- Explore climate storytelling beyond catastrophe through adaptation mysteries, eco-horror analysis, solarpunk design, and game-system critiques.
| Pressure | Opening | |
|---|---|---|
| #1 | False certainty: declaring that one event was ‘caused by climate change’ can misrepresent attribution research and damage credibility. | Create a recurring 60-second ‘signal check’ that explains one chart, one caveat, and one practical consequence. |
| #2 | Context collapse: cropping axes, omitting baselines, or confusing local records with global ones can make true data misleading. | Build fandom-specific explainers, such as how heat affects cosplay materials, outdoor queues, location shoots, PC cooling, or esports venues. |
| #3 | Synthetic disaster media: AI-generated fires, floods, and storm images can spread faster than corrections, especially during breaking news. | Partner with climate scientists, emergency managers, health experts, animators, and data journalists for verified crossover streams. |
| #4 | Trauma exploitation: graphic footage and disaster reaction content can dehumanize affected communities or expose private information. | Turn passive viewers into contributors through local observation logs, open-source map annotation, subtitle translation, and mutual-aid fundraising. |
| #5 | Doom fatigue: nonstop catastrophe framing may drive avoidance, helplessness, or hostile polarization instead of durable engagement. | Develop reusable source cards, correction templates, chart presets, and moderation macros as part of a creator verification toolkit. |
For professionals
For editors, producers, brand teams, and community leads, climate coverage should be treated as a verification-sensitive beat rather than a seasonal content trend. Assign one person to own source validation and another to challenge the narrative framing. Maintain an approved source ladder: primary observational agency, peer-reviewed paper or assessment, qualified expert, then reputable secondary reporting. Record the dataset version, retrieval date, baseline, unit, geographic scope, and whether figures are provisional. Require disclosures for sponsors, travel support, advocacy relationships, and carbon-market partners. Before release, conduct a harm review covering vulnerable people, precise locations, graphic imagery, evacuation information, and accessibility. Add captions, alt text, colorblind-safe palettes, and plain-language definitions. Establish a correction protocol with severity levels: minor visual fix, material factual update, or full retraction. Finally, evaluate success with more than views. Track source-link clicks, completion rate, meaningful questions, correction frequency, moderator load, resource downloads, and whether viewers can accurately restate the core finding. The professional standard is not sterile neutrality; it is transparent, evidence-led storytelling with calibrated language and visible accountability.

From viral health hacks to AI screenshots and movie “accuracy” wars, the biggest science mistake is treating confidence as evidence. Here is a field guide for thinking clearly without draining the fun from fandom.

From cosmic gaming environments to viral space theories, discover how the universe fuels epic stories, electrifies fan communities, and launches creators into new dimensions of content.

From 'The Day After Tomorrow' chills to real-world impacts, dive into the blockbuster story of climate change. This isn't just science; it's the ultimate narrative affecting every game, movie, and livestream.

How to turn NASA alerts, telescope images, launches, eclipses, and mysterious radio bursts into accurate, cinematic content your fandom can explore together.

From wildfire-orange livestream skies to climate-coded anime, environmental signals shape what audiences watch, share, remix, and believe. Here is how creators can turn daily planetary data into gripping stories without sacrificing accuracy.
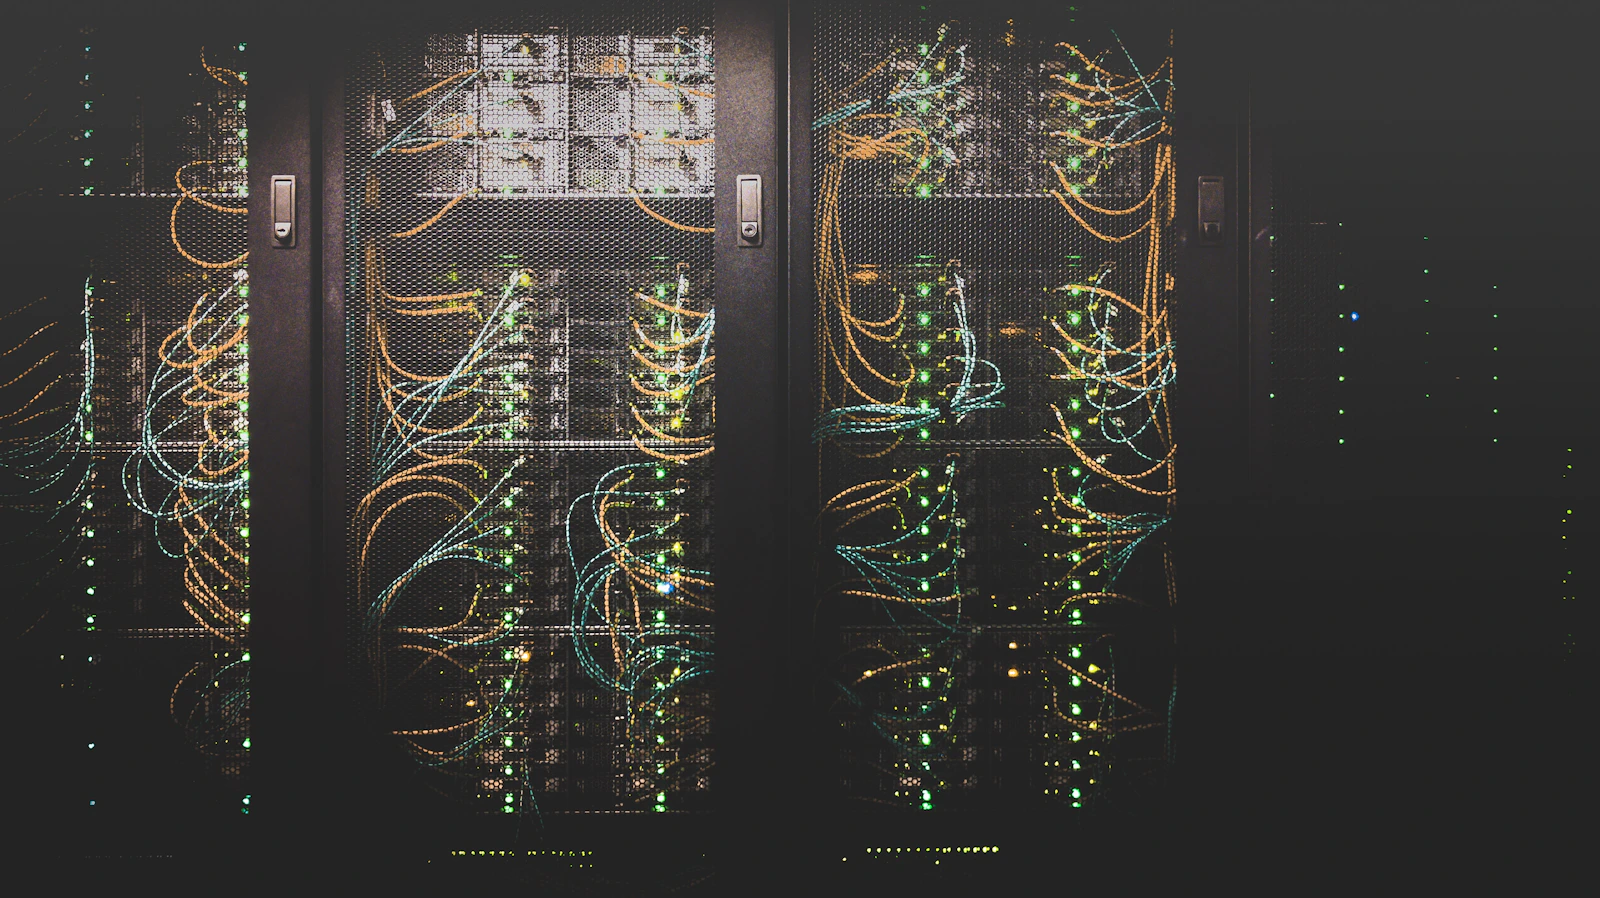
Climate data is not background noise. It shapes production schedules, game worlds, fandom campaigns, livestream safety, and the stories audiences believe. Here is how to turn the planet’s daily dashboard into smart, cinematic content—without drifting into doom, hype, or misinformation.