Environment Daily Signal: Creator & Fan Guide
From wildfire-orange livestream skies to climate-coded anime, environmental signals shape what audiences watch, share, remix, and believe. Here is how creators can turn daily planetary data into gripping stories without sacrificing accuracy.
 Eitan CohenCybersecurity reporter
First published 7/2/2026 · last revised 8/5/2026 with fresh sources, corrections, and new context. Reader corrections are reviewed and folded into future versions.
Summary
The environment generates a nonstop signal: heat records, air-quality alerts, storm tracks, shifting seasons, wildlife sightings, satellite images, and energy milestones. For creators and fandoms, these updates are more than background news. They influence filming conditions, livestream safety, game worlds, movie conversations, cosplay events, travel plans, and the memes through which communities process uncertainty. This CineMind guide explains how to find trustworthy signals, translate them into cinematic narratives, and invite audience participation without turning every weather event into apocalypse bait. The winning formula is simple: lead with a vivid human moment, verify the underlying measurement, explain what is known and uncertain, then give viewers a meaningful way to respond.
Key takeaways
- Separate weather from climate: one storm is an event, while climate is the long-term pattern changing the odds and intensity of some events.
- Start with primary sources such as NASA, NOAA, the World Meteorological Organization, the IPCC, Copernicus, and local environmental agencies.
- Treat maps and dashboards like production assets: show timestamps, units, geographic limits, color scales, and update schedules.
- Never imply that climate change caused a specific disaster unless an attribution study supports that conclusion; discuss altered likelihood or intensity when evidence permits.
- Build stories around recognizable stakes—closed sets, smoky convention air, overheated hardware, disrupted releases, or fans documenting local change.
- Audience participation works best when prompts collect comparable observations instead of encouraging risky storm chasing or unverified claims.
- Pair danger with agency. Solutions, adaptation, and community action retain attention without manufacturing false optimism.
- Archive sources and corrections. Environmental data can be revised, and transparent updates strengthen creator credibility.
Explain like I'm 5
Imagine Earth is running the biggest livestream ever. Thermometers, ocean buoys, satellites, rain gauges, and air sensors fill the chat with numbers. A single message—today was hot—is weather. When millions of messages reveal that hot days are becoming more common over decades, that is climate. Creators are the highlight editors: they choose which moments to clip and explain. A responsible editor checks that the clip is real, says where and when it happened, and does not pretend one dramatic moment proves the whole storyline. Fans can join by sharing safe, dated observations, comparing reliable maps, and asking what the numbers mean—not by treating every viral cloud, flame, or frozen street as final proof.
Deep dive
The Planet Is a Content Engine—But It Is Not a Content Farm
Environmental information arrives with blockbuster imagery: hurricanes spiraling from orbit, cities under red wildfire light, cracked reservoirs, bioluminescent waves, and auroras flooding short-form feeds. That visual force makes the topic perfect for movies, games, anime analysis, YouTube explainers, and live reaction formats. It also makes exaggeration dangerously easy. A reposted flood clip may be years old; a temperature map may use colors designed to reveal small differences rather than announce the apocalypse. The creator’s job is not to drain the drama. It is to earn it. Ask four questions before publishing: Who measured this? What exactly was measured? Over what place and period? What uncertainty or limitation matters? Put the date and location on-screen, link the source, and preserve the original unit. If converting Celsius to Fahrenheit, show both. If a satellite image uses false color, label it. Accuracy is not an end-credit chore; it is part of the spectacle.
Weather Is the Scene; Climate Is the Franchise Arc
A thunderstorm is a scene. Climate is the season-long arc governing which scenes become more probable. The World Meteorological Organization generally uses 30-year periods for climate normals; NOAA’s current U.S. normals cover 1991–2020. That distinction helps creators avoid two common traps: claiming one cold snap disproves global warming, or declaring that every hurricane was individually caused by it. Event-attribution science instead compares the observed world with modeled worlds lacking or reducing human influence. Researchers may conclude that warming made an event more likely or more intense, often with a quantified range. Say exactly that. For fast coverage before attribution exists, discuss established background mechanisms—warmer air can hold more water vapor, for example—without assigning a verdict to one event. Think courtroom thriller, not speed-run conviction.
Build a Daily Signal Stack
Create a compact monitoring workflow. Start with local meteorological and emergency agencies for immediate hazards. Add NOAA and NASA for U.S. and global observations, Copernicus Climate Change Service for European and planetary datasets, the WMO for worldwide synthesis, and the IPCC for assessed long-term science. For air quality, use official national or municipal networks and understand the local Air Quality Index scale; AQI categories are not identical everywhere. Use keyword alerts for locations, productions, conventions, species, and infrastructure relevant to your channel. Save a screenshot or dataset link with its timestamp because dashboards update. Then triangulate: a viral post is a tip, not confirmation. Reverse-search images, inspect upload history, check landmarks and shadows, and compare the scene with official reports. If verification fails, do not dress speculation in a confident thumbnail.
Turn Data Into a Cinematic Story
Open with a concrete image: a streamer ending early because smoke entered the room, a film set shifting hours during extreme heat, or players rebuilding a flooded city in a survival game. Next, reveal the signal—a particulate reading, wet-bulb warning, rainfall total, or sea-surface temperature anomaly. Then widen the frame: explain the baseline, historical trend, and people affected. Close with agency: safety guidance, adaptation, a reputable project, or a question audiences can investigate. Visual grammar matters. Animate a timeline rather than flashing two cherry-picked years. Keep legends visible on maps. Distinguish projections from observations with explicit labels. When discussing fictional worlds such as Dune, Princess Mononoke, Frostpunk, Horizon, or The Last of Us, separate thematic interpretation from real science. Fiction is an emotional gateway, not a peer-reviewed source.
Make Participation Useful, Safe, and Fun
Fandom can become a distributed observation network when prompts are designed well. Ask viewers to report first frost dates, urban shade temperatures, visible smoke, local bird timing, or convention heat precautions using a template: location at city-level precision, date, time, measurement method, and source photo. Protect privacy by discouraging home addresses and real-time location sharing. Never send fans toward fires, floods, unstable ice, wildlife, or evacuation zones for footage. Offer low-risk formats instead: map-reading streams, climate-movie fact checks, game-design challenges, fan-art prompts, or watch parties paired with expert Q&As. Moderate aggressively when disasters are unfolding; remove fabricated casualty counts, miracle cures, and harassment of scientists or affected communities. A good participation loop leaves viewers more capable, not merely more alarmed.
Measure Trust Alongside Reach
Views alone cannot tell you whether environmental coverage worked. Track source-link clicks, completion rate at explanation segments, correction frequency, repeat viewers, and the quality of audience questions. Test thumbnails for clarity rather than panic: ‘What This Heat Map Actually Shows’ can outperform catastrophe bait by promising a solved mystery. Maintain a public corrections note and update descriptions when agencies revise figures. Disclose sponsorships from energy, travel, technology, advocacy, or nonprofit organizations, including donated equipment and paid trips. Finally, budget for emotional tone. Constant doom can exhaust both host and audience; relentless positivity can erase real harm. Alternate hazard coverage with restoration, adaptation, engineering, policy, and community success stories. CineMind’s rule: deliver the monster reveal, show the mechanics, and give the ensemble cast something credible to do before the credits roll.
- 1988The Intergovernmental Panel on Climate Change is established by the WMO and the United Nations Environment Programme to assess climate science, impacts, and response options.
- 1992The UN Framework Convention on Climate Change is adopted, creating the international framework that later hosts annual COP negotiations.
- 1997The Kyoto Protocol is adopted, setting binding emissions targets for participating industrialized countries; it enters into force in 2005.
- 2005YouTube launches, accelerating creator-led science communication and making environmental footage instantly remixable—and easier to strip from context.
- 2015The Paris Agreement is adopted on December 12, aiming to hold warming well below 2°C and pursue efforts to limit it to 1.5°C above preindustrial levels.
- 2018The IPCC releases its Special Report on Global Warming of 1.5°C, sharpening public discussion of risks at different warming levels.
- 2021–2023The IPCC publishes its Sixth Assessment Report cycle, including the 2023 Synthesis Report summarizing observed change, risks, mitigation, and adaptation.
- 2023Copernicus reports 2023 as the warmest year in its global temperature record at the time, roughly 1.48°C above the 1850–1900 average.
- 2024Copernicus reports that 2024 became the warmest year on record and the first calendar year measured above 1.5°C relative to the preindustrial level, while stressing that the Paris threshold concerns a longer-term average.
Glossary
- Attribution science
- Research estimating how human-driven climate change or other factors altered the probability or intensity of a specific event.
- Climate normal
- A long-period average—typically 30 years—used to compare current conditions with an established baseline.
- Anomaly
- The difference between an observed value and a chosen baseline, such as temperature relative to a 1991–2020 average.
- Air Quality Index (AQI)
- A public scale translating pollutant concentrations into health categories; formulas and thresholds vary by country.
- False-color image
- A visualization assigning non-natural colors to measured wavelengths or values so features such as heat, vegetation, or smoke are easier to see.
- Wet-bulb temperature
- A measure combining heat and humidity that helps indicate the limits of evaporative cooling and human heat stress.
- Mitigation
- Action that reduces greenhouse-gas emissions or increases removals, limiting future climate change.
- Adaptation
- Adjustment to actual or expected climate effects, such as cooling centers, flood defenses, or heat-resilient production schedules.
- Greenwashing
- Marketing that creates a misleading impression of environmental benefit without evidence proportionate to the claim.
- Citizen science
- Research in which members of the public collect, classify, or analyze data using defined methods and expert oversight.
FAQs
Can I say climate change caused a particular wildfire or hurricane?+
Usually not as a simple yes-or-no claim. Cite a relevant attribution study and use its wording about changed likelihood or intensity. Fire outcomes also depend on ignition, fuel, land management, wind, and response.
What is the fastest reliable source during breaking weather?+
Use the official meteorological service and emergency-management authority for the affected location. Global dashboards add context but should not replace evacuation orders or local warnings.
Are red and purple weather maps inherently misleading?+
No. Color is a design choice, but maps become misleading when creators hide the legend, crop the date, compare incompatible scales, or imply that color alone proves unprecedented danger.
Does one year above 1.5°C mean the Paris Agreement’s limit has permanently failed?+
No. A single calendar year above 1.5°C is significant, but the agreement’s temperature goal is understood in terms of long-term warming, not one temporary annual reading.
May I reuse NASA or NOAA imagery in videos?+
Much U.S. federal material is public domain, but logos, third-party assets, endorsements, and specific datasets can have restrictions. Check the usage page for each asset and provide clear credit.
How should livestreamers cover an active disaster?+
Pin official safety links, delay graphic footage, verify casualty figures, avoid exposing private locations, and do not restream emergency radio traffic or imagery without checking legal and ethical constraints.
How can fandoms contribute without becoming amateur forecasters?+
Join established citizen-science projects, submit observations through defined forms, annotate public datasets, or host expert-guided discussions. Do not issue unofficial warnings that could compete with authorities.
How do I discuss eco-themes in films, anime, and games accurately?+
Frame the fiction as a cultural lens, identify the real mechanism it resembles, and cite scientific sources separately. A story can illuminate values even when its ecology is intentionally fantastical.
Predictions
- Hyperlocal environment streams will grow as creators combine official alerts, neighborhood sensors, and audience reports—but verification labels will become a competitive advantage.
- Games and virtual productions will use more real climate datasets to generate dynamic weather, seasonal events, and educational simulations.
- Platforms and advertisers will place greater scrutiny on synthetic disaster footage as generative video makes convincing fake storms, fires, and wildlife scenes cheap to produce.
- Heat, smoke, flooding, and power reliability will become routine production-planning variables for festivals, esports events, outdoor shoots, and creator conventions.
- Audience appetite will shift from generic doom montages toward explainers that connect hazards with adaptation, engineering, public health, and local action.
- Provenance tools—content credentials, original-file metadata, and cryptographic signing—will become central to verifying viral environmental imagery.
Risks
- Disaster porn can exploit victims, flatten complex events into spectacle, and reward creators for arriving before facts do.
- Old or synthetic footage may be miscaptioned as breaking news, sending donations, anger, or rescue attention in the wrong direction.
- Badly explained scales—AQI systems, temperature anomalies, forecast cones, or logarithmic charts—can create false reassurance or panic.
- Real-time fan submissions can expose homes, evacuation routes, minors, or vulnerable wildlife locations.
- Undisclosed sponsors may distort coverage of energy, transport, food, tourism, or consumer technology.
- Repeated catastrophic framing can cause audience fatigue, anxiety, disengagement, or hostility toward affected communities.
- Creators who enter hazard zones risk injury and may obstruct emergency workers; compelling footage never outranks official restrictions.
- Overconfident predictions can damage trust when models, tracks, or initial measurements are revised as better data arrives.
Opportunities
- Launch a weekly ‘Planet Patch Notes’ show that explains what changed, what did not, and which viral claims need debugging.
- Partner with climatologists, meteorologists, ecologists, health specialists, and data-visualization artists for expert-led reaction streams.
- Build fan challenges around shade mapping, biodiversity observations, restoration art, or low-carbon production design using established citizen-science protocols.
- Create climate fact checks for franchises such as Dune, Godzilla, Avatar, Frostpunk, and Princess Mononoke while clearly separating metaphor from measurement.
- Offer downloadable creator kits containing source checklists, map-label templates, correction cards, and safe livestream moderation prompts.
- Profile adaptation as compelling design: heat-resilient venues, floodable parks, passive cooling, microgrids, and greener virtual-production stages.
- Use multilingual captions and local expert voices so global environmental stories are not filtered exclusively through distant English-language commentary.
| Pressure | Opening | |
|---|---|---|
| #1 | Disaster porn can exploit victims, flatten complex events into spectacle, and reward creators for arriving before facts do. | Launch a weekly ‘Planet Patch Notes’ show that explains what changed, what did not, and which viral claims need debugging. |
| #2 | Old or synthetic footage may be miscaptioned as breaking news, sending donations, anger, or rescue attention in the wrong direction. | Partner with climatologists, meteorologists, ecologists, health specialists, and data-visualization artists for expert-led reaction streams. |
| #3 | Badly explained scales—AQI systems, temperature anomalies, forecast cones, or logarithmic charts—can create false reassurance or panic. | Build fan challenges around shade mapping, biodiversity observations, restoration art, or low-carbon production design using established citizen-science protocols. |
| #4 | Real-time fan submissions can expose homes, evacuation routes, minors, or vulnerable wildlife locations. | Create climate fact checks for franchises such as Dune, Godzilla, Avatar, Frostpunk, and Princess Mononoke while clearly separating metaphor from measurement. |
| #5 | Undisclosed sponsors may distort coverage of energy, transport, food, tourism, or consumer technology. | Offer downloadable creator kits containing source checklists, map-label templates, correction cards, and safe livestream moderation prompts. |
For professionals
For working creators, treat environmental coverage as a production beat with formal standards. Assign one person to verify location, capture time, licensing, measurement units, and original source before an asset enters the edit. Keep a source ledger containing URLs, archived copies, contact names, permissions, and revision notes. Use a two-source rule for consequential breaking claims and prioritize primary agencies over aggregators. Scripts should label observation, interpretation, projection, and opinion as different categories. For field work, complete a hazard assessment covering heat, smoke, lightning, floodwater, communications, insurance, evacuation triggers, and crew stop-work authority. Never ask freelancers or fans to accept danger for a shot. Sponsorship agreements should preserve editorial independence and require disclosure in-video and in-description. When errors happen, correct the original post visibly rather than relying on a later upload. The professional payoff is durable trust: viewers learn that your channel can deliver cinematic urgency without treating uncertainty, suffering, or science as disposable props.
Sources & references
- IPCC Sixth Assessment Report: Synthesis Report
- World Meteorological Organization — State of the Global Climate
- NASA Global Climate Change: Evidence
- NOAA Climate.gov — Climate Data and Education
- Copernicus Climate Change Service
- UN Framework Convention on Climate Change — The Paris Agreement
- World Weather Attribution
- U.S. Environmental Protection Agency — Air Quality Index Basics

From viral health hacks to AI screenshots and movie “accuracy” wars, the biggest science mistake is treating confidence as evidence. Here is a field guide for thinking clearly without draining the fun from fandom.

From cosmic gaming environments to viral space theories, discover how the universe fuels epic stories, electrifies fan communities, and launches creators into new dimensions of content.

From 'The Day After Tomorrow' chills to real-world impacts, dive into the blockbuster story of climate change. This isn't just science; it's the ultimate narrative affecting every game, movie, and livestream.

A creator-first field guide to reading climate signals, separating weather from trend, turning data into compelling stories, and keeping fan communities informed without feeding doom, hype, or misinformation.

How to turn NASA alerts, telescope images, launches, eclipses, and mysterious radio bursts into accurate, cinematic content your fandom can explore together.
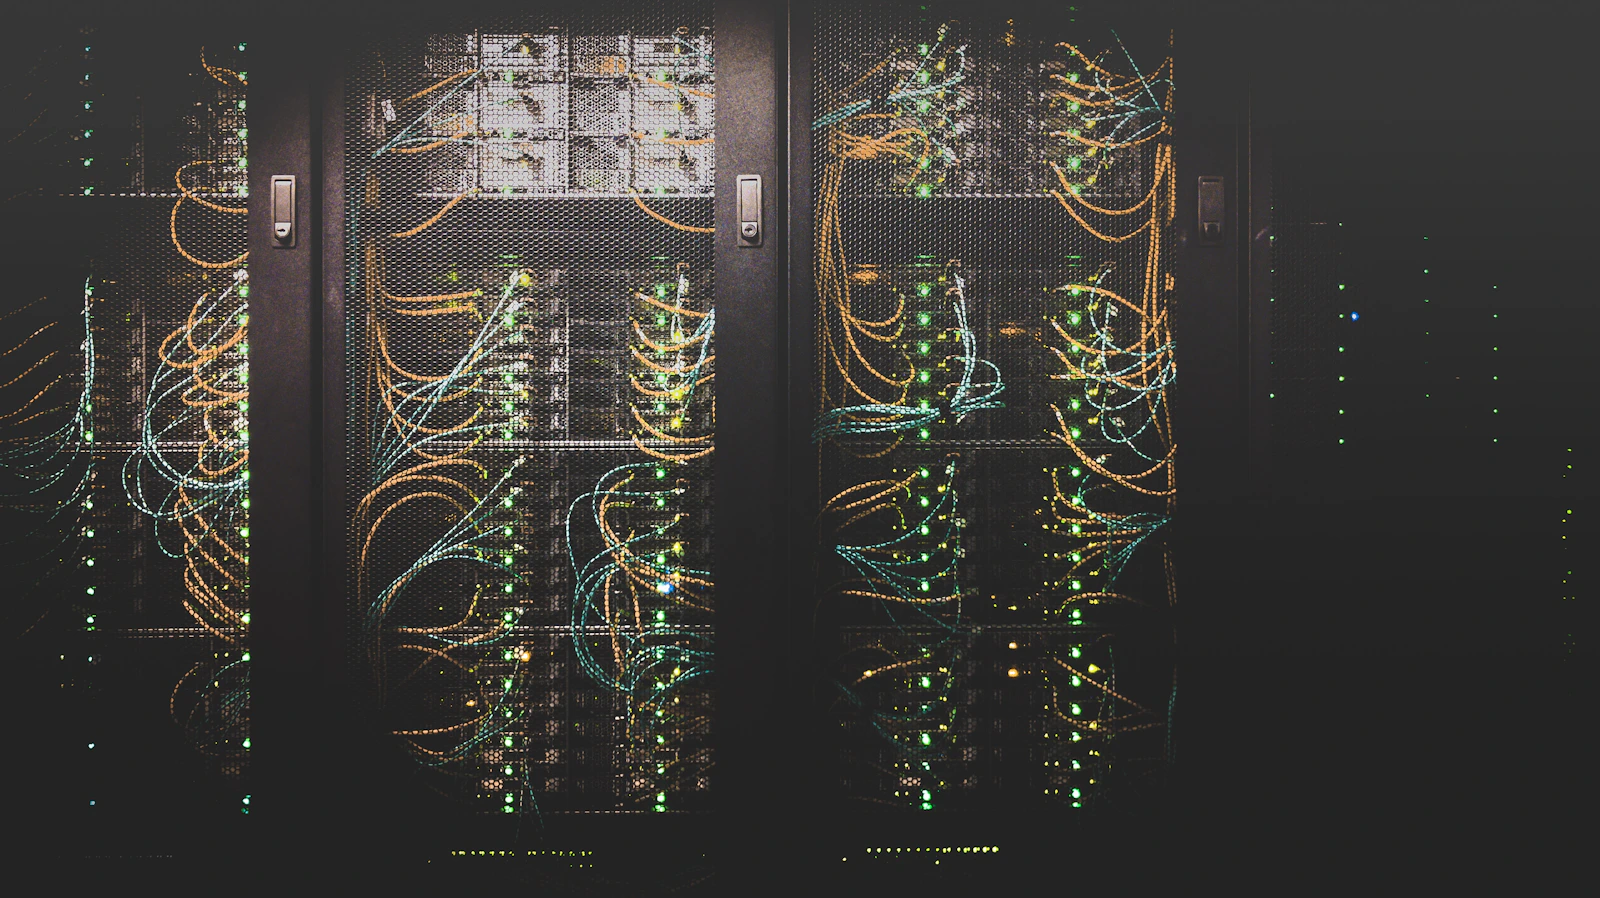
Climate data is not background noise. It shapes production schedules, game worlds, fandom campaigns, livestream safety, and the stories audiences believe. Here is how to turn the planet’s daily dashboard into smart, cinematic content—without drifting into doom, hype, or misinformation.